증감 중심 평가의 한계
전체 사용량이 줄어도 난방, 냉방, 기저부하 가운데 한 경로는 늘 수 있고, 총량이 늘어도 특정 요소기술의 개선 효과는 남아 있을 수 있습니다. 총량 하나로는 공사 효과와 운영·사용 변화를 구분하지 못합니다.

Green Remodeling · 사후평가 원인추론
노후 공공건축물의 그린리모델링은 단열을 보강하고 창호를 바꾸고 설비를 손봅니다. 그런데 사후평가는 대개 공사 전과 후의 에너지 사용량 총량 하나로 성과를 판정합니다. 총량에는 공사만 담기지 않습니다. 다시 쾌적해진 건물은 더 오래, 더 넓게 쓰이고, 난방 연료가 바뀌면 계량기가 세는 범위 자체가 달라집니다.
이 프로젝트는 건물이 남긴 기록을 지식그래프로 구조화하고, 규칙 50종으로 증거를 뽑고, 변화점 모델로 사용량을 세 경로로 나눈 뒤, Dempster-Shafer 증거이론으로 결합해 "왜 변했는가"를 근거와 함께 답하는 진단 체계입니다.
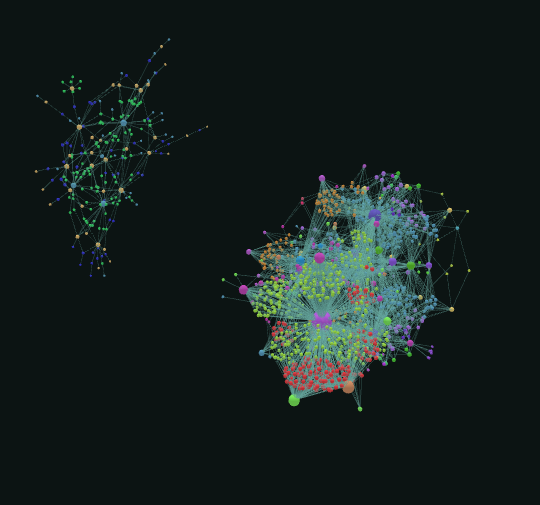 건물 1개소 · 지식그래프 63,513 트리플
문제
현행 성과평가는 에너지 절감량 중심의 정량 평가에 집중합니다. 그래서 다음 네 가지 한계가 반복됩니다.
전체 사용량이 줄어도 난방, 냉방, 기저부하 가운데 한 경로는 늘 수 있고, 총량이 늘어도 특정 요소기술의 개선 효과는 남아 있을 수 있습니다. 총량 하나로는 공사 효과와 운영·사용 변화를 구분하지 못합니다.
에너지원 전환, 계량기 교체, 계측 범위 변경이 생기면 같은 기준의 전후 비교 자체가 성립하지 않습니다. 실제 성능 변화와 계측 조건 변화가 분석 결과에 뒤섞입니다.
도면, 성능보고서, 시험성적서, 현장사진, 열화상 같은 자료는 담당자가 하나하나 열어 봐야 하고 그 안의 외피·설비·운영 정보는 판단 근거에서 빠지기 쉽습니다.
건물마다 보유 자료의 종류와 수준이 다릅니다. 필요한 자료가 없는 상태를 기준 미충족이나 원인 없음으로 처리하면 실제와 다른 결론이 나옵니다.
체계
진단은 손으로 고치는 곳 없이 여섯 단계를 순서대로 지나며 만들어집니다. 앞 단계의 산출물이 다음 단계의 입력이 되고 같은 입력은 언제나 같은 결론을 냅니다. 증거를 뽑는 방식은 처음부터 끝까지 유지했고 가설 계층만 4가설과 케이스 분류에서 3경로 일치·불일치 체계로 다시 설계했습니다.
도면, 사진, 보고서, 고지서, 운영현황을 온톨로지에 따라 건물별 지식그래프로 전사합니다.
그래프 질의로 규칙 50종을 충족, 미충족, 판정 불가로 판정하고 근거 원문과 질의문까지 기록합니다.
변화점 모델로 사용량을 난방 기울기, 냉방 기울기, 기저부하로 나눠 공사 전후 변화를 봅니다.
경로마다 관측 방향과 증거의 우세 방향을 맞대어 현상 유형을 정하고 그에 맞는 가설집합을 엽니다.
멱집합 위의 Dempster-Shafer 결합으로 가설별 지지도와 불확실성, 충돌계수 K를 산출합니다.
단일 판별, 부분집합 한정, 판별 보류 가운데 하나로 끝나고 모든 문장은 근거 원문으로 내려갑니다.
1단계 · 온톨로지와 지식그래프
건물별 문서철에는 도면, 현장사진, 운영현황 시트, 에너지 고지서, 성능보고서가 흩어져 있습니다. 한 건물에서 200개가 넘는 파일이 나오기도 합니다. 이 자료를 공통 어휘로 정의한 온톨로지에 따라 건물별 지식그래프로 옮깁니다.
| 원천자료 | 처리 |
|---|---|
| 도면 (DWG) | 로컬 변환기를 거쳐 엔티티 표와 PDF로 바꾼 뒤 텍스트, 블록, 레이어를 분석합니다. |
| 현장사진 | 파일명 규칙으로 층과 피사체를 연결하고 외관·간판·외장재·창호를 서술하는 비전 캡션을 붙입니다. 한 건물에 최대 325장, 4건물 합계 728장입니다. |
| 운영현황 (xlsx) | 실, 면, 개구부, 설비 시트를 트리플로 전사합니다. 그린리모델링 이전, 이후, N년차의 세 벌 상태를 따로 둡니다. |
| 에너지 고지서 · 정량평가 보고서 | 월별 사용량 시계열을 추출하고 스캔 고지서를 비전으로 판독해 교차검증합니다. |
| 성능보고서 · 준공도서 (HWP, PDF) | 외피 열관류율과 적용 항목을 전사합니다. |
| 문서 전반 | 청크로 나눈 뒤 로컬 임베딩으로 건물별 Graph RAG를 구성합니다. |
822트리플의 온톨로지는 건물, 공간, 외피, 설비, 운영, 문서를 정의하는 빈 양식입니다. 개별 사실은 전부 건물 그래프에 있습니다. 예를 들어 '탈의실'은 온톨로지에 0회, 한 건물의 그래프에 42회 등장합니다.
건물을 하나씩 추가할 때 새로 필요한 어휘가 +27, +119, +5, +3으로 급감했고, 커버리지는 16%에서 88%, 91%, 93%로 올라갔습니다. 삭제나 재정의 없이 추가만으로 진화했습니다.
온톨로지와 매핑 코드를 한 번 만들면 건물 추가는 LLM 호출 없이 실행됩니다. 4건물 재구축에 5.0초가 걸렸고 한 건물의 그래프는 63,513트리플로 온톨로지의 77배 규모입니다. 정의역·치역 감사 34,400건에서 실질 모순은 0건이었습니다.
2단계 · 증거 규칙
지식그래프에 질의를 던져 규칙 50종을 판정합니다. 규칙마다 질의, 판단 조건, 요구 자료, 자료 출처, 예상 영향 방향이 정해져 있어 같은 입력에는 같은 기준이 적용됩니다.
연간, 하계, 동계 사용량의 증가와 절감 여부를 봅니다.
기울기, 기저부하, 변화점 온도의 증감입니다. 현행 체계에서는 관측 단계로 옮겨 다룹니다.
가스통이나 난방유처럼 계측이 어려운 연료에서 도시가스처럼 계측 가능한 에너지원으로 바뀌었는지 봅니다. 진단 서사를 좌우하는 핵심 규칙입니다.
재실 시간과 인원, 만족도, 공조 면적과 공조실 수의 증감입니다.
히트펌프 COP, 보일러 효율, 전열교환기의 효율과 신설 여부입니다.
외벽, 창호, 최상층, 최하층 열관류율의 전후 비교입니다.
계절에 따른 일사 취득의 변화입니다.
조명 밀도, 급탕 효율, 태양광 생산량입니다.
열화상으로 확인한 시공 후 열교 부위의 증가입니다.
모든 판정은 answer detail source query의 네 항목으로 기록됩니다. 결론에서 근거 원문과 질의문까지 되짚을 수 있습니다.
자료가 없으면 판정 불가로 두고 자료 부재를 원인 부재로 오인하지 않습니다.
외피 열관류율이 실측인지, 에너지평가 프로그램 산정인지, 설계 기준 추정인지를 기록하고 이후 신뢰도에 반영합니다.
동일한 사실이 여러 규칙으로 중복 결합되지 않도록 출처 단위로 묶습니다.
3단계 · 변화점 모델
변화점 모델(CPM)은 외기온도와 에너지 사용량의 관계를 구간별 직선으로 표현하는 통계 모델입니다. 건물의 형상과 재료를 입력하는 물리 시뮬레이션과 달리, 실제 사용 패턴에서 건물의 운전 특성을 거꾸로 읽어냅니다. 공사 전후에 같은 모델을 적합해 기저부하(B0), 난방 민감도(B1), 냉방 민감도(B2)의 변화를 비교합니다.
경로마다 증가, 감소, 변화 미미(±2% 이내), 비교 제외(전후 한쪽 모델에 항 부재)의 넷 중 하나로 판정합니다. 경로를 하나로 합친 통합 점수는 두지 않습니다.
잔차만 보는 적합 대신 데이터 적합도와 모델 복잡도를 함께 보는 AIC 벌점을 적용해 3P와 5P 모델 사이의 과적합을 막습니다.
처음에는 외기온 보정 시계열을 우선했으나, 원본 워크북에서 보정 시계열과 실측 사용량이 어긋나는 내부 불일치를 발견해 실측 원시 사용량 기준으로 통일했습니다. 이 원칙 덕분에 LPG에서 도시가스로 계측이 편입되며 원시 총량이 두 배가 된 건물이 착시가 아니라 계측 범위 변경으로 올바르게 진단되었습니다.
워크북이 없는 건물은 정량평가 PDF의 월별 차트를 픽셀 단위로 디지타이즈했습니다. 그리드라인으로 축척을 잡고 인쇄된 연간 총량을 앵커로 보정해 오차 ±1%를 확보했고, 스캔 고지서 39페이지의 비전 판독과 대조해 17건 모두 일치했습니다.
4단계 · 일치와 불일치
경로마다 관측 방향과 증거의 우세 방향을 맞댑니다. 증거 세기는 E = Σ p·w·r 로 방향별 합산하되, 같은 출처 그룹은 최대값에 잔여 50%만 더해 중복을 할인합니다. 둘이 같으면 일치, 다르면 불일치입니다. 일치는 "어느 공사가 주도했나"를 묻고, 불일치는 "왜 어긋났나"를 묻습니다.
질문은 "어느 조치가 주된 설명인가"입니다.
질문은 "왜 기대와 다른가"입니다.
어떤 가설집합을 열지 정하는 장치이며 개별 증거의 성격이 아닙니다.
가설집합이 정해진 뒤 증거는 특정 가설을 지지하거나, 반증하거나, 판단을 남깁니다.
서로 배타적인 집합을 지지하는 증거가 만날 때만 생깁니다. 불일치 자체는 K가 아닙니다.
| 현상 | 증거 | 초점집합 | 이유 |
|---|---|---|---|
| 일치 | 우세 방향 규칙 | {h} 또는 {b} | 해당 영역을 직접 지지합니다. |
| 일치 | 반대 방향 규칙 | Θ 전체 | 판별 정보가 없으므로 버리지 않고 중립으로 결합합니다. |
| 불일치 | 관측과 같은 방향 규칙 | {d1} | 관측 방향의 실재 요인이자 압도 후보입니다. |
| 불일치 | 반대 방향 규칙 · 실측급 | {d1, d3, d4} | 조치의 실재가 확인되어 d2 미구현을 배제합니다. |
| 불일치 | 반대 방향 규칙 · 설계값 | Θ 전체 | 판별력이 없어 미구현 가능성을 그대로 둡니다. |
| 불일치 | R13 에너지원 전환 = Y | {d3} | 계측 경계 변경의 직접 증거입니다. 예외 게이트는 두지 않습니다. |
반증 증거를 다른 가설에 나눠 주지 않습니다. 외벽 열관류율 증가는 "외피가 주원인"을 반증할 뿐 설비나 운영을 지목하지 못하므로, 여집합 {설비, 운영, 기타}에 질량을 둡니다. 여기에 보일러 효율 증가가 {설비}를 직접 지지하면 두 집합의 교집합이 {설비}로 좁혀집니다. 결론은 커지는 대신 좁혀집니다.
가설은 "외피 영향 있음"이 아니라 "외피가 관측된 변화의 주된 설명이다"로 정의합니다. 외피와 설비는 현실에서 동시에 작용할 수 있지만 주원인 판정이라는 질문에서는 경쟁 가설이 됩니다. 그래서 높은 K는 물리적 모순이 아니라 증거들이 서로 다른 주원인을 강하게 주장한다는 신호입니다.
5단계 · 증거 결합
Dempster-Shafer 증거이론은 믿음의 질량을 개별 가설이 아니라 가설 집합에 배분하는 일반화 확률이론입니다. 증거가 부족하거나 서로 상충해도 임의로 배제하지 않고 불확실성과 충돌 정도를 함께 산출합니다.
m은 증거가 가설 집합에 배분하는 기본신뢰질량이고, K는 서로 모순되어 부딪힌 질량의 몫입니다. K는 정규화로 숨기지 않고 단계별로 보존해 보고합니다.
규칙 판정 하나가 증거가 되려면 세 파라미터가 붙습니다. 셋의 곱이 그 증거의 유효 질량이 되고 나머지는 전체 집합에 남습니다.
증거가 그 가설을 얼마나 집어 지지하는지 나타냅니다.
전체 증거 체계에서 해당 증거가 갖는 상대적 중요도입니다.
증거를 만든 자료와 출처의 신뢰도입니다.
| 결합 단계 | 유효 질량 | K | 외피 | 설비 | 운영 | 미정 | 질량 분포 |
|---|---|---|---|---|---|---|---|
| ① 외피 근거 | 0.70 → {외피} | 0.00 | 0.70 | 0.00 | 0.00 | 0.30 | |
| ② 냉난방 설비 근거 | 0.50 → {설비} | 0.35 | 0.54 | 0.23 | 0.00 | 0.23 | |
| ③ 재실 근거 | 0.30 → {운영} | 0.23 | 0.49 | 0.21 | 0.09 | 0.21 |
증거 세 개를 차례로 결합한 예시입니다. 외피 지지도는 0.70에서 0.49로 내려가지만 여전히 1위이고, 설비 근거가 들어오는 순간 K가 0.35로 튀어 경합이 드러납니다. 미정 0.21은 아직 판단하지 못한 몫으로 남습니다.
한 가설의 지지도가 충분히 앞섭니다.
특정 가설은 배제되지만 남은 후보를 가르지 못합니다. 예를 들어 d2 기대성능 미구현만 배제된 상태입니다.
증거가 설계값뿐이거나 상충이 커서 판단을 보류합니다. 억지로 1위를 만들지 않습니다.
결합은 표준 직교합을 16개 부분집합의 멱집합으로 확장했고 출처 그룹 안에서 먼저 결합한 뒤 그룹 사이에서 결합합니다. 산출은 질량, 신뢰도 Bel, 개연성 Pl, 최종 확률 BetP입니다. 질량 합 1, K<1 보존, 결합 순서 불변, 가중치 0 무영향, 완전 무지 불변, 중복 배제, 부분집합 질량 해석 일치를 포함한 단위 테스트 14건을 통과했습니다.
아래 슬라이더로 증거 세 개의 유효 질량을 바꿔 보십시오. 가설별 지지도와 미정, 충돌계수 K가 즉시 다시 계산됩니다. 반증 증거를 켜면 질량이 여집합에 놓이는 것을 볼 수 있습니다.
교육용 예시입니다. 실제 엔진은 경로별 관측과 규칙 판정, 출처 그룹 할인까지 반영한 멱집합 결합을 수행합니다.
6단계 · 실증
보건지소, 보건진료소, 어린이집 9개소를 대상으로 기록 수집부터 최종 결론까지 전 과정을 돌렸습니다. 구 5건물은 2018년과 2023년을, 신 4건물은 2019년과 2024년을 비교했으므로 건물 사이의 사용량 수치를 직접 비교하지는 않습니다. 동결된 정본 결과와의 교차검증 9건이 모두 일치했습니다.
| 건물 | 총량 | 난방 기울기 B1 | 냉방 기울기 B2 | 기저부하 B0 | 관리 유형 |
|---|---|---|---|---|---|
| 건물 1 보건지소 | −54.8% | +33.4% 불일치 d1 0.73 | −69.3% 일치 h1 0.87 | −71.9% 일치 b1 0.59 | 성과 확정 · 증가 요인 발견 |
| 건물 2 보건진료소 | −30.5% | −30.5% 일치 h1 0.88 | 비교 제외 | −32.2% 일치 b1 0.74 | 성과 확정 |
| 건물 3 보건지소 | −22.5% | −20.7% 일치 h1 0.89 | −22.6% 일치 h1 0.92 | −9.4% 증거 없음 | 성과 확정 |
| 건물 4 어린이집 · R13=Y | +17.5% | +7.6% 불일치 d3 0.61 | 비교 제외 | +1.5% 변화 미미 | 성과 재산정 · 계측 착시 |
| 건물 5 어린이집 · R13=Y | +99.9% | −21.3% 일치 h1 0.71 | 비교 제외 | +42.5% 불일치 d3 0.57 | 성과 재산정 · 공사·계측 분리 |
| 건물 6 어린이집 | +4.9% | +50.9% 증거 없음 | 비교 제외 | +18.9% 불일치 {d1, d3, d4} | 현장조사 대상 |
| 건물 7 어린이집 | +26.1% | −4.5% 일치 h1 0.93 | 비교 제외 | +113.6% 일치 b4 0.71 | 운영 안내 · 분리 보고 |
| 건물 8 보건진료소 | −15.0% | 비교 제외 | −54.0% 일치 h2 0.82 | −15.8% 불일치 판별 보류 | 성과 확정 · 기저 보류 |
| 건물 9 보건진료소 | +75.0% | 비교 제외 | −35.0% 일치 h1 0.58 h2 경합, K 0.63 | +85.5% 불일치 {d1, d3, d4} | 현장조사 우선 배정 |
가설 라벨: h1 외피 · h2 설비 · h3 운영 · h4 환경·기타 / b1 조명 · b2 급탕·상시설비 · b3 태양광 · b4 운영·상시부하 / d1 미관측 요인 압도 · d2 기대성능 미구현 · d3 계측·에너지원 경계 · d4 변화점 모델·데이터 문제. 숫자는 최종 확률 BetP입니다. 총량은 각 건물의 실측 원시 사용량 기준이며, 건물 사이의 직접 비교를 위한 값이 아닙니다.
절감이 실재한 경로에서는 증거가 실제로 한 공사를 지목했습니다. 외피를 고친 곳은 외피가, 히트펌프와 전열교환기를 새로 단 곳은 설비가 답으로 나왔습니다.
도시가스 편입은 d3 계측 경계로, 재실 증가에 따른 상시부하는 b4 운영·상시부하로 갈라져 나왔습니다. 같은 건물 안에서도 공사 효과 h1과 계측 편입 d3가 경로별로 따로 설명되었습니다.
총량이 절반 넘게 준 건물에서 난방 경로만 증거와 반대로 움직였고, 공조 면적과 실 수의 확장이 절감 효과를 압도한 것으로 판별되었습니다. 총량만 보는 평가는 이 신호를 지나칩니다.
구 체계는 계측 범위 변경을 케이스 9라는 예외 규칙으로 먼저 선언해야 했습니다. 신 체계에서는 같은 건물이 게이트 없이 증거 결합만으로 d3 0.61에 이르렀습니다.
증거가 설계값뿐인 기저 경로는 1위를 지어내는 대신 판별 보류로 남겼고, 두 건물은 {d1, d3, d4}로 한정해 현장조사 대상으로 넘겼습니다.
신 4건물의 결과는 동결본과 완전히 일치했고, 구 5건물은 정본 셀프테스트의 재검증 방식을 그대로 확장해 투입했습니다. 디지타이즈 시계열은 고지서 원본 대조 17건 전부 통과했습니다.
관리와 서비스
건물별 결과를 성능 변화, 원인 유형, 판별 가능성에 따라 네 가지 관리 유형으로 나누고 후속 조치를 연결합니다.
성능이 기준에 맞고 원인이 명확한 정상 사례는 유형별로 추적 관리합니다.
기준을 벗어났지만 원인이 확인된 이상 사례는 원인 분석과 개선으로 넘깁니다.
변화는 있는데 원인이 불명확한 사례는 현장조사 대상으로 잡습니다.
데이터가 부족한 추가 조사 사례는 우선순위를 매겨 관리합니다.
전 과정은 AI 에이전트가 호출하는 도구 모음으로 묶여 있습니다. 변화점 모델 시그니처, 규칙 질의, 지식그래프 검색, 경로 관측, 증거 결합, 민감도, 현장조사 우선순위 도구가 표준화된 입출력으로 이어집니다. 담당자는 자연어로 질의해 건물, 설비, 운영 사이의 연관과 판단의 출처 원문을 함께 확인합니다.
진단 한 건은 자립형 HTML 파일 하나로 담깁니다. 지식그래프, 규칙 판정, 증거 정리, 증거 결합, 시계열, 최종 소견의 여섯 화면이 한 파일에 들어 있고 모든 결론은 클릭 한 번으로 근거 원문까지 내려갑니다.
전망
지금은 진단 하나가 파일 하나입니다. 전문가가 며칠을 들여 읽던 일을 에이전트가 처음부터 끝까지 매번 같은 방식으로 해냅니다. 다음은 규모입니다. 2021년부터 2026년까지 전국 공공건축물 그린리모델링 사업지는 4,452건에 이릅니다. 같은 규칙과 같은 잣대로 읽은 진단이 쌓이면 건물 하나로는 보이지 않던 패턴이 드러납니다. 어떤 조치가 어떤 유형의 건물에서 계속 효과를 내는지, 왜 같은 공사가 어느 곳에서는 성공하고 어느 곳에서는 사용량에 묻히는지 말입니다.
새 검침값이 들어올 때마다 진단이 갱신되고, 누구든 건물에게 "왜"를 물으면 근거가 달린 답을 듣습니다. 자기 에너지 이야기를 스스로 설명하는 공공건축물, 이 프로젝트가 향하는 곳입니다.
자립형 데모는 요청 시 시연합니다.